Another small console program I’d like to introduce as part of the Admin Tips series is top.
The top program provides a dynamic, real-time system overview. It can display system summary information as well as a list of processes or threads currently managed by the Linux kernel. The types of system summary information displayed, as well as the types, order, and size of information displayed for processes, are user-configurable.
The program provides a limited interactive interface for process manipulation, as well as a much more extensive interface for personal configuration, covering every aspect of operation.
The ‘top’ program is part of the ‘procps’ or ‘procps-ng’ package (depending on the distribution) and is available in most Linux distributions.
Syntax
top -hv | -bcEeHiOSs1 -d secs -n max -u | U user -p pid(s) -o field -w [cols]
Options
-h : Help
-v : Version
-d : Runs top in batch mode, allowing command output to be piped to a file or other programs
-c : Toggle command line/program name
-d : Delay time interval
-e : Toggle task memory scaling
-E : Toggle memory scaling summary
-H : Run in threaded mode
-i : Idle toggle
-n : Limit number of interactions
-o : Override sorting field
-O : Output field names
-p : Process ID monitoring mode
-s : Run in safe mode
-S : Cumulative time toggle
-u : User filtering mode
-w : Output width override
-l : Toggle single/separate processor states
Examples
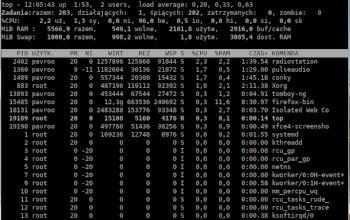
To list all running Linux processes on your system, type:
top
Use the top command to send any signal to a running process. Press the k key and enter the process’s PID. Top allows you to enter the signal you want to send. Failure to enter a specific signal kills the process.
By default, top sorts the process list using the %CPU column. To sort processes using a different column, press one of the following keys:
M Sort by %MEM
N Sort by PID
T Sort by TIME+
P Sort by %CPU
The ‘-u’ option allows you to display all processes for the selected user. Press the u key while top is running, or use the following syntax:
top -u username
Use the E key to select the units to use for displaying memory values. Press the lowercase e to select the units for displaying values in the process list. Available options are:
– kibibytes (KiB)
– mebibytes (MiB)
– gibibytes (GiB)
– tebibytes (TiB)
– pebibytes (PiB)
– exbibytes (EiB – applies only to memory values)
Emphasize information in the output by adding color to the output. Press z to add color to the display.
To see the full command line instead of the process name, press c. To return to displaying the process name, press c again.
To see which processes have been started or invoked by other processes, press V.
To filter the output and display only active tasks, press I.
Press n to limit the process number in the output. Regardless of the number of active processes, top asks you to specify the number of processes you want to see.
The top filtering function allows you to use a filter expression to limit which processes are visible in the list. Enable the filtering option by pressing the o key. The program prompts you to enter a filter expression.
To access all available top options, use the following commands:
man top
top -h
its similar to htop, which is more clear