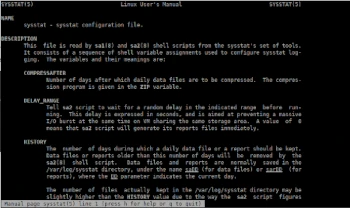
In today’s Admin Tips post, we’ll cover sysstat.
Sysstat is a Linux tool for measuring system performance.
The sysstat package includes the following tools for measuring system performance:
– sar: collects and reports system activity;
– iostat: reports CPU usage and disk I/O statistics;
– tapestat: reports statistics for tape drives connected to the system;
– mpstat: reports global and per-CPU statistics;
– pidstat: reports statistics for Linux tasks (processes);
– sadf: displays data collected by sar in various formats;
– cifsiostat: reports I/O statistics for CIFS file systems.
Sysstat’s key features:
– Displays average statistics at the end of reports.
– Detects new devices (disks, network interfaces, etc.) that are dynamically created or registered on the fly. – Support for UP and SMP machines, including machines with hyperthreaded or multi-core processors.
– Support for hotplug processors (automagically detects processors that are powered off or on-the-fly) and tickless processors.
– Runs on a wide variety of architectures, 32- or 64-bit.
– Requires very little CPU time to run (written in C).
– System statistics collected by sar/sadc can be saved to a file for future reference. You can configure the length of the history data to be stored. There is no limit on the length of this history, but the amount of free space on the storage device is.
– System statistics collected by sar/sadc can be exported in various formats (CSV, XML, JSON, SVG, etc.). DTD and XML Schema documents are included in the sysstat package. JSON output is also available for the mpstat and iostat commands. – iostat can display statistics for devices managed by user-space drivers, such as spdk.
– Intelligent color display for easier reading of statistics.
– Internationalization support (sysstat has been translated into many different languages). Sysstat is now part of the translation project.
– Sysstat commands can automatically select the unit used for displaying sizes for easier reading (see the –human option).
– Graphs can be generated (SVG format – Scalable Vector Graphics) and displayed in your favorite web browser.
Sysstat also includes utilities that can be scheduled via cron or systemd to collect and history performance and activity data:
– sar collects, reports, and logs system activity information (see below for a list of metrics collected by sar).
– sadc is the activity data collection system used as a backend for sar.
– sa1 collects and stores binary data in a daily system activity data file. This is a frontend to sadc designed to be run from cron or systemd.
– sa2 generates a summary of daily activity reports. It is a frontend to sar designed to be run from cron or systemd.
– sadf displays data collected by sar in multiple formats (CSV, XML, JSON, etc.) and can be used to exchange data with other programs. This command can also be used to plot graphs of various activities collected by sar using the SVG (Scalable Vector Graphics) format.
System statistics collected by sar:
– I/O and transfer rate statistics (global, per device, per partition, and per network file system)
– Processor statistics (global and per CPU), including support for virtualization architectures
– Memory, huge page, and swap space usage statistics
– Virtual memory, paging, and error statistics
– Process creation activity
– Interrupt statistics (global, per processor, and per interrupt, including potential APIC interrupt sources, hardware, and software interrupts)
– Extensive network statistics: network interface activity (number of packets and KB received and transmitted per second, etc.), including network device failures; network traffic statistics for IP, TCP, ICMP, and UDP protocols based on SNMPv2 standards; IPv6-related protocol support
– Fibre Channel traffic statistics
– Software-based network processing (softnet) statistics
– NFS server and client activity
– Socket statistics
– Run queue and system load statistics
– Kernel internal table usage statistics
– Swap statistics
– TTY device activity
– Power management statistics (instantaneous and average CPU clock speed, fan speed, device temperature, voltage inputs)
– USB devices connected to the system
– Filesystem usage (inodes and blocks)
– Pressure and stall information statistics
The sysstat package is available in the repositories of most Linux distributions and can be installed using the package manager.
Examples
View current CPU usage
sar -u
To view real-time CPU usage five times with a 1-second difference.
sar -u 1 5
To view detailed usage for each processor core individually, use the -P ALL command.
sar -P ALL 1 3
View device usage
iostat -d 1 5
View resource usage for a running process
pidstat -d
Memory usage data
sar -r 1 5
For more information about the sysstat utility, see the man page:
man sysstat

